Wladimir Pazmiño
Portfolio›Case studies›More is More›Social listening engine·More is More · 2026

Social listening engine: reaching the communications director before the press.

A communications director receives an alert six hours before a journalist calls — because the conversation was already building and the system saw it. That is the social listening engine I built and shipped as a product: real scraping, a navigable conversation graph, and an alert with one job.

Social listeningAIGraph analysisScrapingEarly warningProduct
What it does

Listening tools report. This one anticipates.

Most listening platforms are dashboards of yesterday: volume, sentiment, a word cloud. Useful for a monthly report, useless at the moment that decides a reputation. The design brief here was narrower and harder — detect the conversation that is about to matter, while there is still time to act on it.

90

tracked terms defining the monitoring universe

~5,000

mentions in the working corpus

80+

real press headlines ingested alongside social

x5.1

volume against the moving average — the kind of spike the alert layer is built to catch

The conversation graph

93 nodes, 115 edges, four kinds of thing.

The graph is where this product stops being a dashboard. A volume chart tells you something is happening; the graph tells you what is connected to what — which emerging term is attaching itself to which entity, and through which outlet it is travelling.
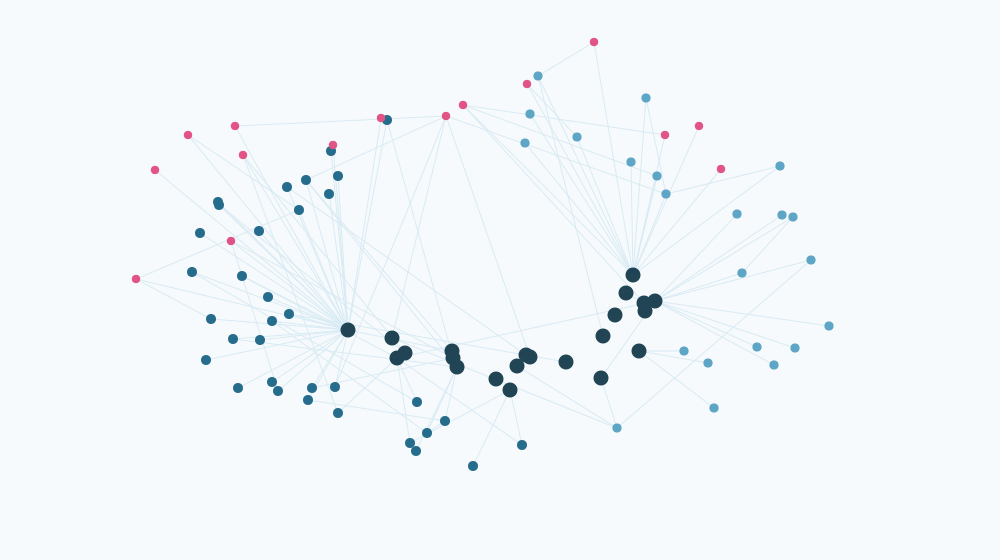
Conversation graph: 93 nodes and 115 edges. Dark navy hubs are entities, mid-blue nodes are topics, light blue are media outlets and magenta are emerging terms, all clustered around the entity hubs they attach to.
The graph structure as the product renders it — navigable, filterable by node type, with search. Rebuilt here as vector rather than screenshotted: the client's terms are their intelligence, not my portfolio material.
Node type

Entities

The organisations and actors being tracked. The hubs everything else attaches to.

Node type

Topics

The established themes of the category — the conversation that always exists.

Node type

Emerging terms

Language that was not there last week. The most valuable nodes on the board, and the reason the graph exists.

Node type

Media outlets

Where a topic crosses from social into press — the moment a conversation stops being containable.

Reading it is the skill. An emerging term with one edge is noise. The same term acquiring edges to two entities and a national outlet inside 48 hours is a situation, and the difference between those two readings is worth more than any sentiment score.

How it is built

Real scraping.

The unglamorous decision that makes the product possible: the data is collected, not licensed. Commercial listening APIs price by volume and cover Latin American media badly — so the ingestion layer is ours.

Social ingestion

Authenticated GraphQL collection from X, running as scheduled Python agents rather than through a metered third-party API.

Press ingestion

RSS and section crawling of national news outlets, including television newsrooms — the sources that decide when a topic becomes public.

Classification

Every mention resolved against the 90-term universe and typed into the graph: entity, topic, emerging or media.

Detection

Volume against moving average per term. A spike is not an alert until it clears a threshold and shows direction.

Alert with an action

Each alert carries a severity — critical, high, medium — and a suggested action. An alert without a recommended move is just an interruption.

The stack, and why it is deliberately boring

PHP, MySQL and two charting libraries. No framework, no build step.

A consultancy product that only its author can deploy is a liability. This one runs on shared hosting, deploys over FTP and has no build pipeline — so it can be handed over, and so a client's IT department can host it without a conversation about containers.

Backend

PHP 8 · MySQL

Runs on the same hosting as everything else. No orchestration, no monthly cloud bill that grows with curiosity.

Front

Vanilla JS · ECharts · ForceGraph2D

Two libraries doing the heavy lifting — time series and the canvas graph — over plain HTML and JavaScript.

Agents

Python scrapers

The collection layer, scheduled and independent of the app. If a source changes, one agent is rewritten, not the product.

Deploy

FTP, whole-site

Unfashionable and completely reliable. The constraint that keeps the architecture honest.

I put this section in because the technology choices are the marketing decision. A product priced for a mid-market client cannot carry an enterprise infrastructure bill, and choosing a stack that a small team can operate is what makes the margin exist at all.

Why it is in this portfolio

Specifying a product.

This started as a demo for a single prospect and became a product with its own domain, database and roadmap. What I contributed is the part that decides whether such a thing sells: what it must detect, how early, what an alert has to contain to be worth interrupting an executive, and what it can cost to run.

The graph is the clearest example. Nobody asks for a network diagram — they ask for a dashboard. The graph exists because the actual question a communications director has is not "how much are they talking" but "is this spreading, and towards whom".

In your company

What this looks like when you bring it in.

What you get

Alerts on your brand before they become news

Real conversation data, clustered, watched around the clock.

What builds up

A map of how conversations about you form

Who starts them, who spreads them, where they go.

What you stop paying for

A licence that reports yesterday

A product you own, reading the live web.

Keep going